Example Outputs
Explore real sample reports generated from different datasets, including the insight summary, chart choices, refinements, and downloadable PDF output.
Jump to an example
Tap or click to scroll directly to that showcase.
Meteor Strikes
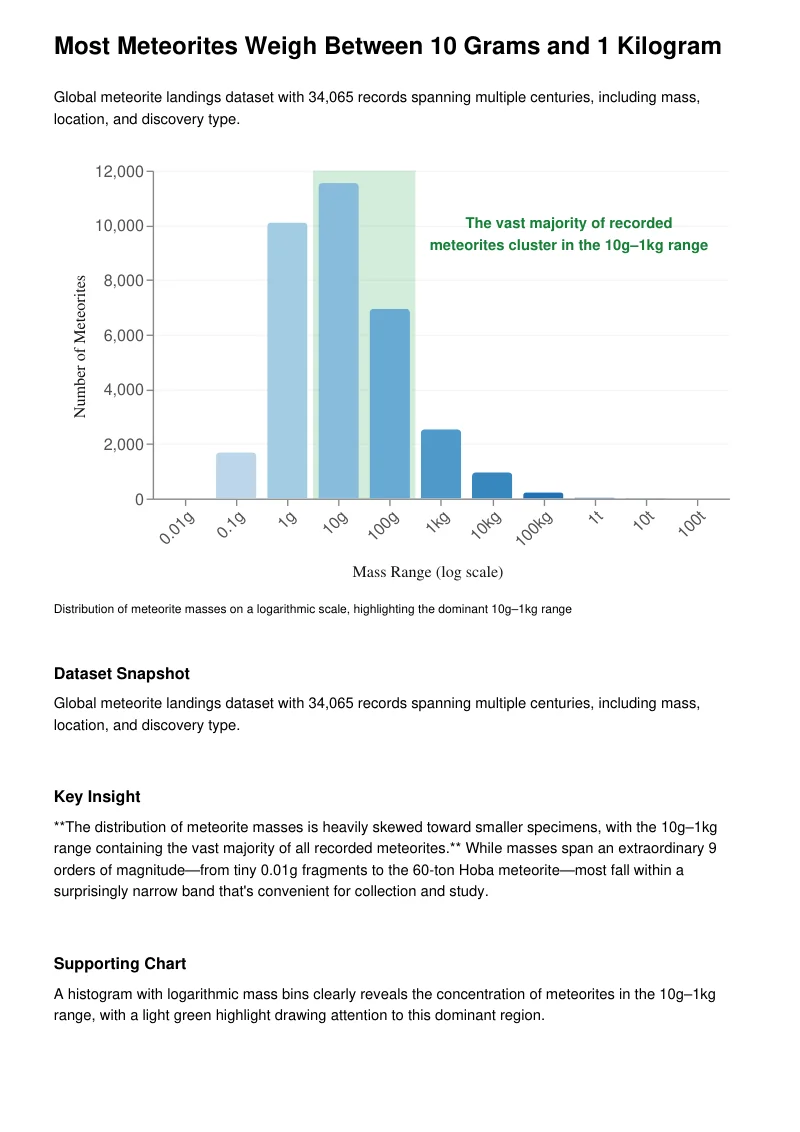
Histogram showing how most recorded meteorites cluster between 10 grams and 1 kilogram.
Iris Flower Clusters
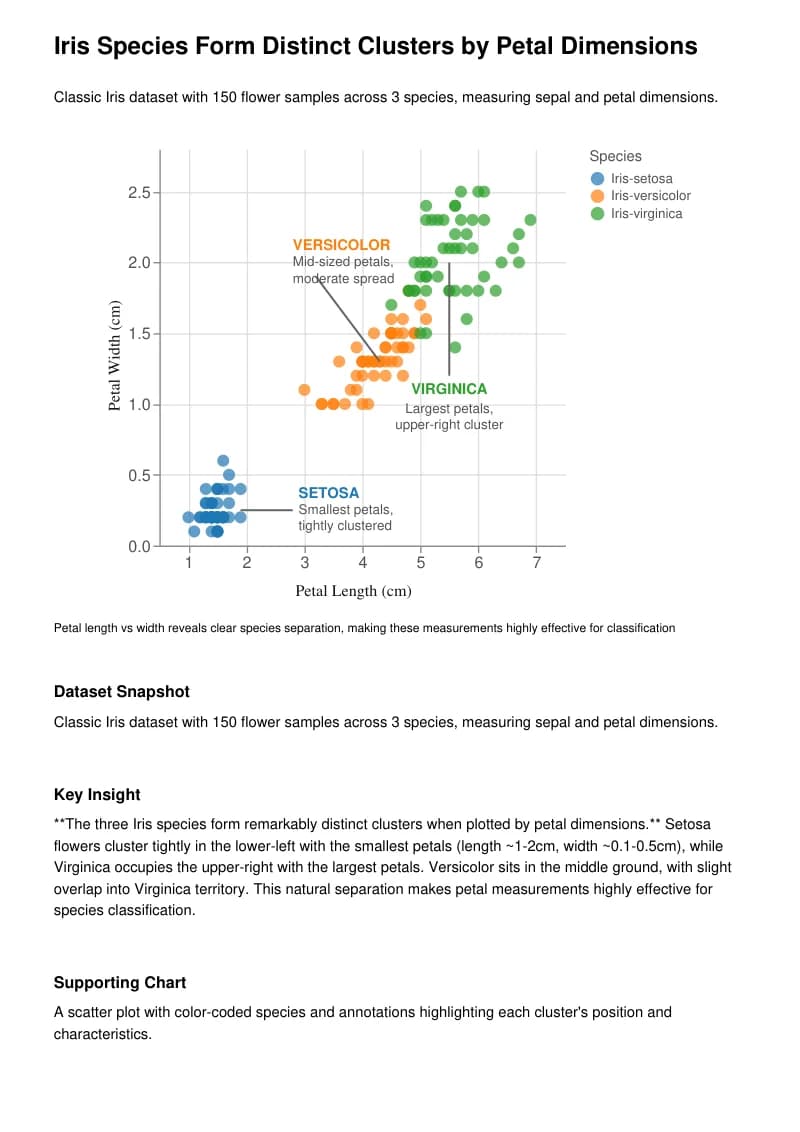
Scatter chart with species-specific callouts showing Iris-setosa vs. others.
Grammy Winners
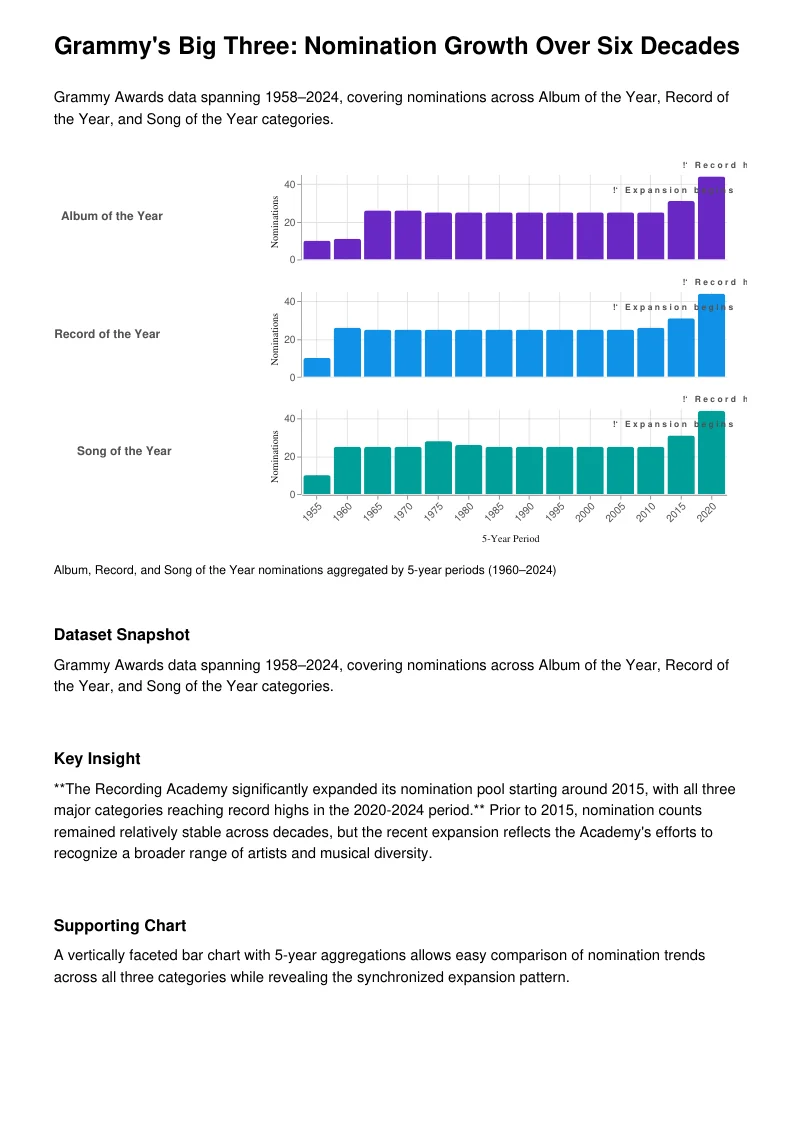
Layered bar/line hybrid showing genre watch as Grammy winners shift over time.
These outputs were generated and refined directly in the app. Replicate them with your own CSV.
Example 1: Meteor Strikes
Mass distribution (log scale) of global meteorite landings
The result
Narrative that highlights the dominant mass range plus a Vega-Lite chart annotated with the 10 g–1 kg spike.
Input CSV
Global meteorite landings (34,065 rows) with mass, location, discovery type, and confidence level columns.
Data adjustments (before generating)
- Mass column log-transformed to evenly space the 9-order range.
- Filtered for confirmed landings to keep the story tight.
- Grouped by decade to soften chart noise before generating the insight.
Refinements made in the AI editor
- Requested greener annotations pointing to the highlighted 10 g–1 kg range.
- Tweaked the x-axis ticks to explicitly list the log scale labels displayed in the mockup.
- Removed the connector line after the annotation felt too busy, then centered the text box.
Final takeaway
The vast majority of recorded meteorites still weigh between 10 grams and 1 kilogram, so that band should anchor any reporting.
Preview + Download
Mass distribution (log scale) of global meteorite landings
Example 2: Iris Flower Clusters
Petal width vs. sepal length across species of iris flowers
The result
Insight narrative that connects sepal length to petal width with a color-coded scatter plot, pointing out how Setosa separates from the rest.
Input CSV
Classic Iris dataset (150 rows) with sepal length, sepal width, petal length, petal width, and species fields.
Data adjustments (before generating)
- Derived a petal-to-sepal ratio column to highlight proportionate differences.
- Capped decimal precision to two places for labels that appear directly on the chart.
- Filtered out duplicate samples that mismatched species labels.
Refinements made in the AI editor
- Asked the AI to expand on why Setosa sits apart and to bold that callout text.
- Shifted the chart legend to the top-right to mirror the reference layout.
- Applied a translucent highlight to the Setosa cluster and increased contrast for the other species.
Final takeaway
Setosa sits alone in the petal width/sepal length space, making it a useful signal for quick differentiation in dashboards.
Preview + Download
Petal width vs. sepal length across species of iris flowers
Example 3: Grammy Winners
Genre trends across decades of the top genres in the Grammy
The result
A narrative that compares genre mix across three decades plus a mixed visualization showing bars for counts and a line for cumulative wins.
Input CSV
All Grammy winners (2000–2023) with year, category, genre, and artist-level metadata.
Data adjustments (before generating)
- Grouped genres into broader buckets (Pop, Rock, R&B/Hip-Hop, Country, Other) to keep the legend readable.
- Smoothed annual counts with a trailing three-year average before chart generation.
- Filled missing genre tags by mapping from official Grammy metadata.
Refinements made in the AI editor
- Requested a teal accent for the line representing total wins to match the brand palette.
- Reordered the legend so Pop appears first, reflecting its prominence in the dataset.
- Adjusted the annotation text to call out the 2017 shift toward R&B/Hip-Hop winners.
Final takeaway
Pop is still king, but the rising R&B/Hip-Hop slices after 2017 suggest a permanent genre shift in the recording academy.
Preview + Download
Genre trends across decades of the top genres in the Grammy
Ready to turn your CSV into insights?
Start your free trial to upload your own file and export presentation-ready outputs.